
Home/Business ecosystem/WiseGIS
WiseGIS logoForest intelligence + decision support

See the forest as
a living data system.

WiseGIS combines satellite imagery, UAVs, LiDAR, mobile field devices and IoT data in an interactive geoportal and rule-based decision-support platform for environmental monitoring.

Discuss this vertical
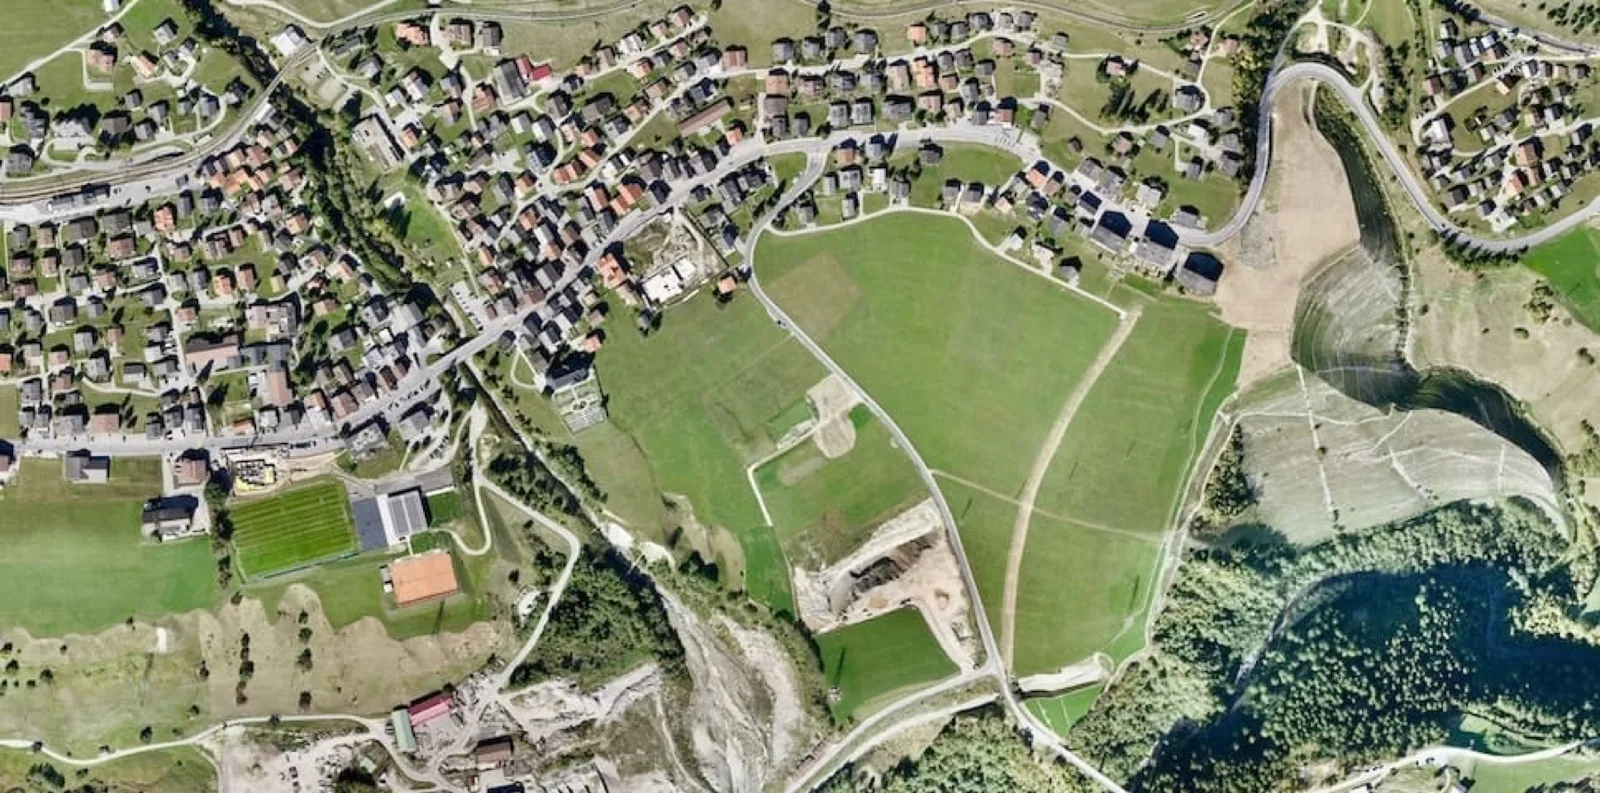
LiDAR forest data visualizationA unit of Envirotask Services Pvt. Ltd.
30+Potential forest data attributes
10 cmStated UAV site-survey accuracy
3DForest and terrain modelling
Use cases

Monitor change, define boundaries and plan field action.

Forest and tree monitoring

  • Deforestation and illegal-activity detection
  • Boundary demarcation
  • Land-use classification and change detection
  • Wildfire management
  • Timber operations and assessment

Monitoring objectives

  • Forest boundary demarcation — one time
  • Forest encroachment — weekly, monthly or quarterly
  • Mining in forest
  • Fire-line monitoring — yearly
  • Water-body change
  • Forest-cover change
  • Forest-type mapping
Unified acquisition

Complementary sensors balance coverage, precision and cost.

Inputs

  • Satellite imagery
  • Drone imagery
  • LiDAR
  • Mobile field devices
  • DEM / DSM
  • IoT integration

Data programme

  • Central repository
  • Yearly data updating
  • Imagery up to 0.8 m
  • 30+ potential attributes
  • 3D forest modelling
  • Precision data from UAV imagery
UAV capability

High-fidelity evidence for difficult and high-risk forest operations.

Field uses

  • Site-management planning
  • Site surveys stated up to 10 cm accuracy
  • Sand-mining evidence
  • Poaching evidence
  • Image and video evidence
  • Digital site boundaries
  • Encroachment detection
  • Water-body mapping
  • 3D slope mapping
  • Tree-species detection
  • Carbon-sequestration assessment

Management outputs

  • Digital Elevation Model (DEM)
  • Canopy Height Model (CHM)
  • Tree density
  • Carbon stock
  • Raw-image correction and tiled drone imagery

Aerial survey profiles

  • 20 MP and 42 MP camera profiles
  • GSD stated at 0.8 cm/px
  • Real resolution stated at 0.9 cm/px
  • Reference altitude of 65 m / 213 ft
  • Plant-counting algorithms for inventory and replanting decisions
LiDAR + 3D site maps

From canopy returns to individual-tree intelligence.

LiDAR characteristics

  • High-speed, high-density topographical collection
  • Day or night scanning in clear flying conditions
  • Intensity reflectance plus x-y-z coordinates
  • Multiple vegetation returns from canopy to ground

3D outputs

  • Georeferenced coloured point cloud
  • Tree and mangrove locations
  • Forest inventory
  • DEM, CHM and DSM
  • Flood modelling
  • Forest-fire management

Plantation intelligence

  • Individual trees and trunks
  • Canopy height, DBH and stem area
  • Plant GPS coordinates
  • Actual plant count
  • Pre- and post-plantation imagery
  • Growth and plant-health monitoring
  • Empty-pit identification
  • Automated tree counts from ortho-maps
  • Flight-path videos with coordinates, date and time
Wise Platform

Last-mile environmental visibility in one data-ready platform.

Experience

  • Interactive geoportal
  • Rule-based decision-support system
  • Smart dashboards
  • Data insights
  • Mobile access

Technology stack

  • Cloud computing
  • Artificial intelligence and machine learning
  • Big data
  • LiDAR data
  • API integration
  • Satellite data
  • Drone data
  • Mobile data
  • IoT integration
Forest intelligence outputs

From raw imagery to a decision-ready forest model.

These are the original geospatial, UAV and LiDAR visuals used in the company profile, presented here as a web-native field-to-platform sequence.
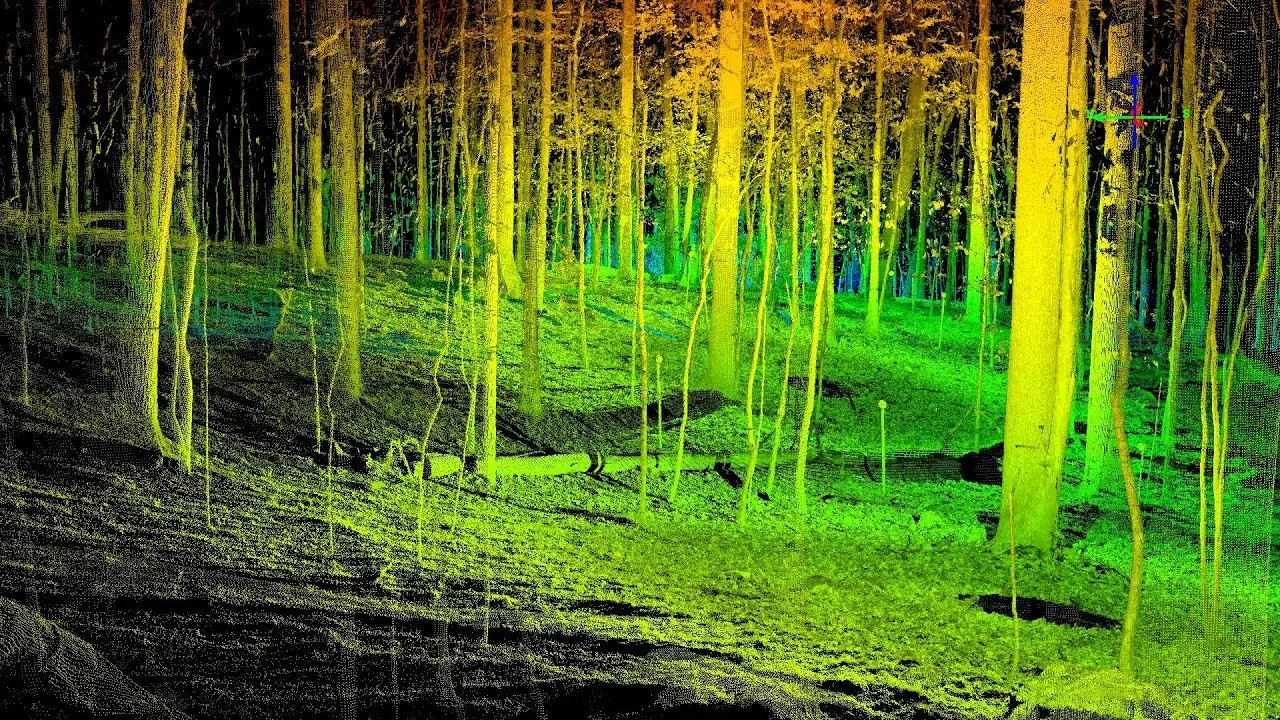
LiDAR forest returns01

LiDAR forest returns

Canopy-to-ground laser returns reveal forest structure.
Mobile field GIS02

Mobile field GIS

Last-mile maps and data access on a field device.
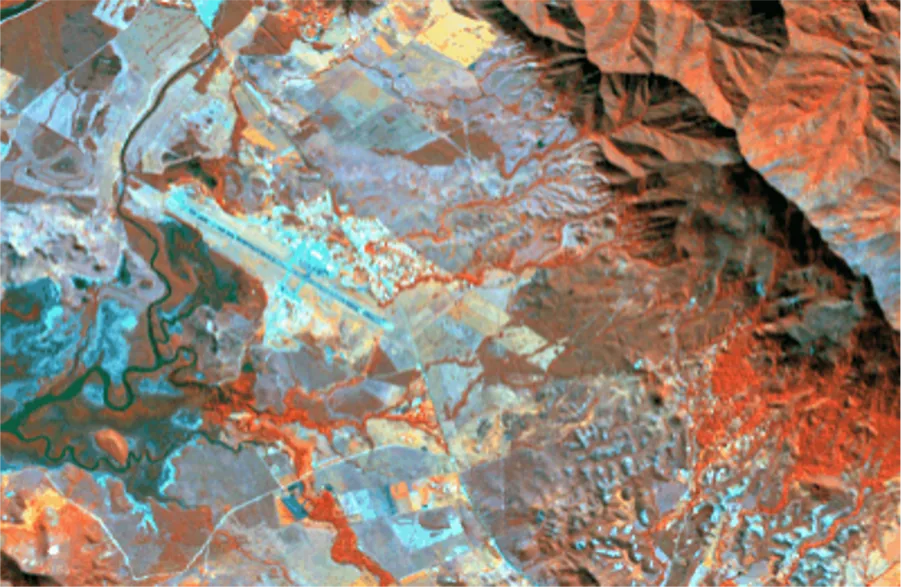
Satellite analysis03

Satellite analysis

Remote-sensing imagery for terrain and land-use interpretation.
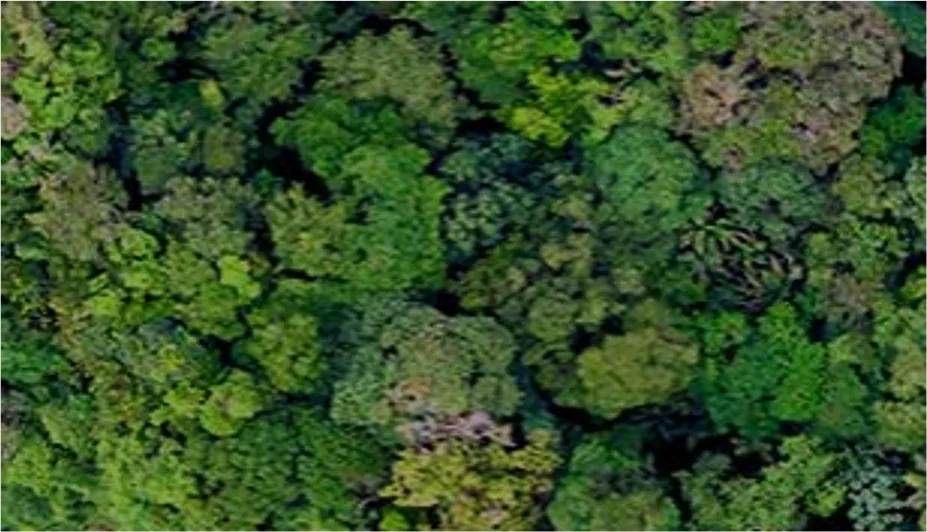
Aerial canopy04

Aerial canopy

High-resolution overhead imagery for forest-cover assessment.
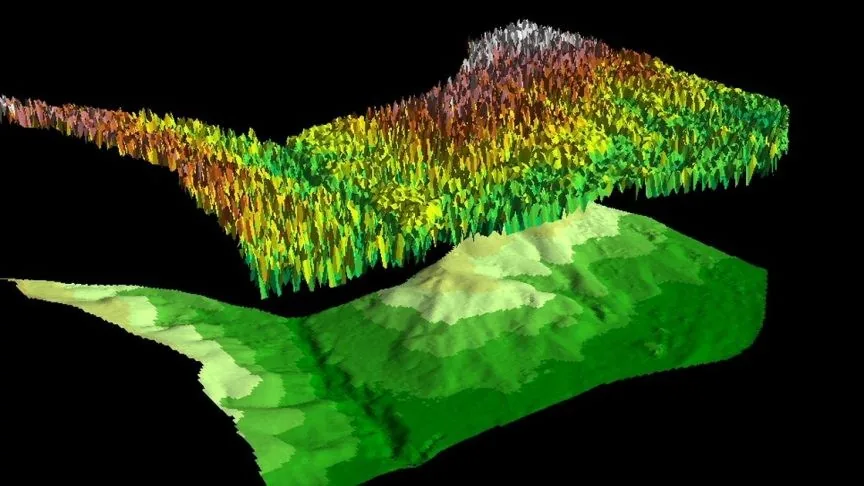
3D terrain model05

3D terrain model

Surface and canopy layers separated for spatial analysis.
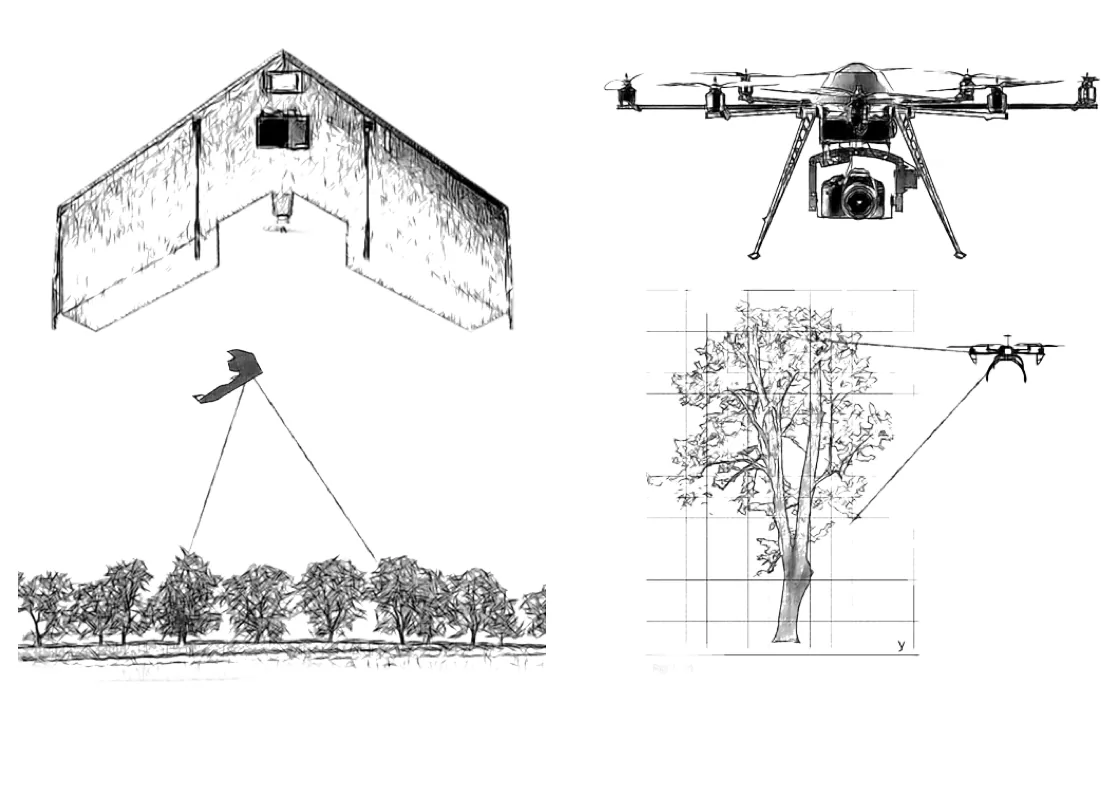
UAV + LiDAR system06

UAV + LiDAR system

Sensor and flight geometry supporting accurate 3D collection.

Plantation point cloud07

Plantation point cloud

Individual planting points derived from aerial survey data.

Plant-count detail08

Plant-count detail

Fine-scale plantation inventory and pattern inspection.
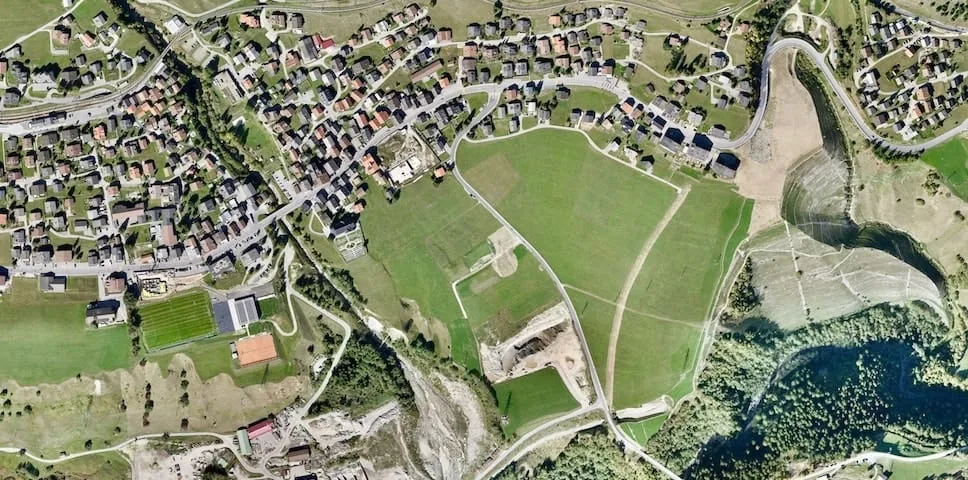
Aerial survey09

Aerial survey

High-resolution source imagery for mapping and change analysis.
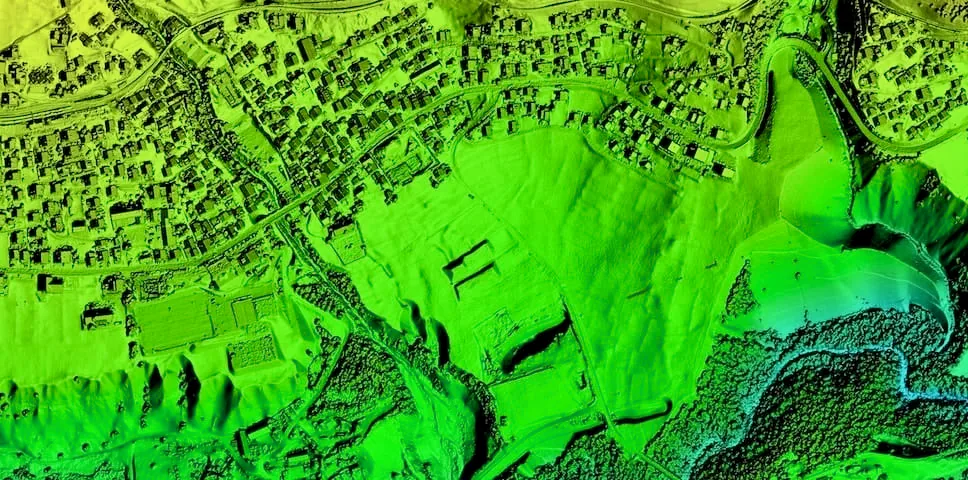
Elevation model10

Elevation model

Colour-coded terrain output for accurate aerial surveys.
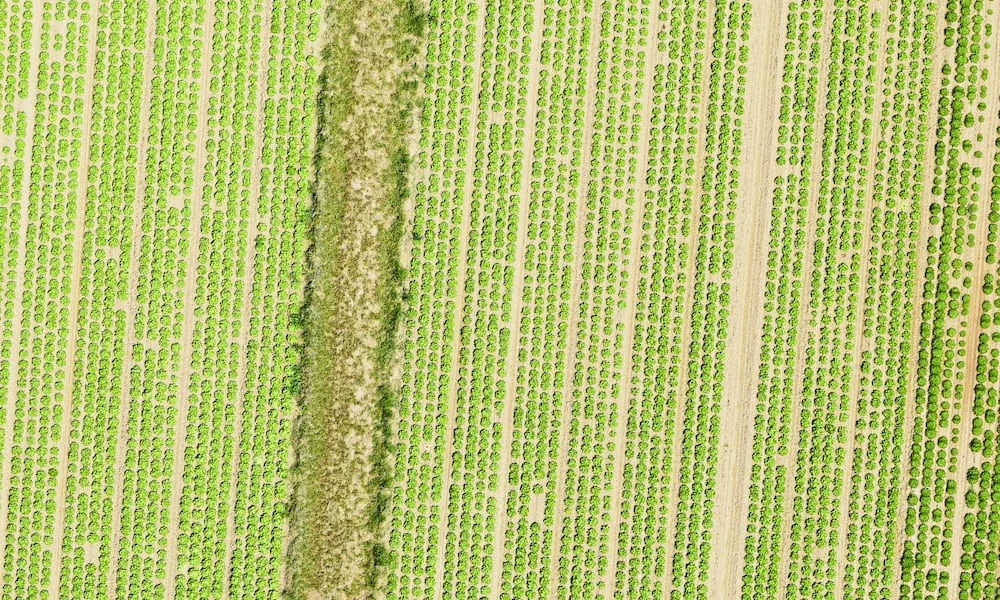
Plantation grid11

Plantation grid

Row-level inventory evidence for monitoring and replanting decisions.
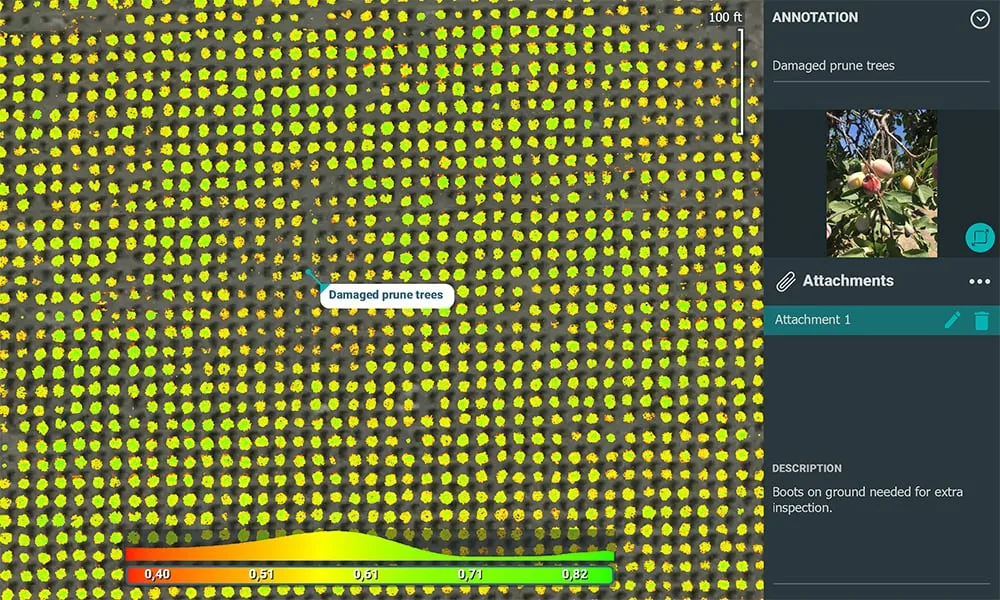
Plant-count dashboard12

Plant-count dashboard

Annotated plantation data connected to operational review.
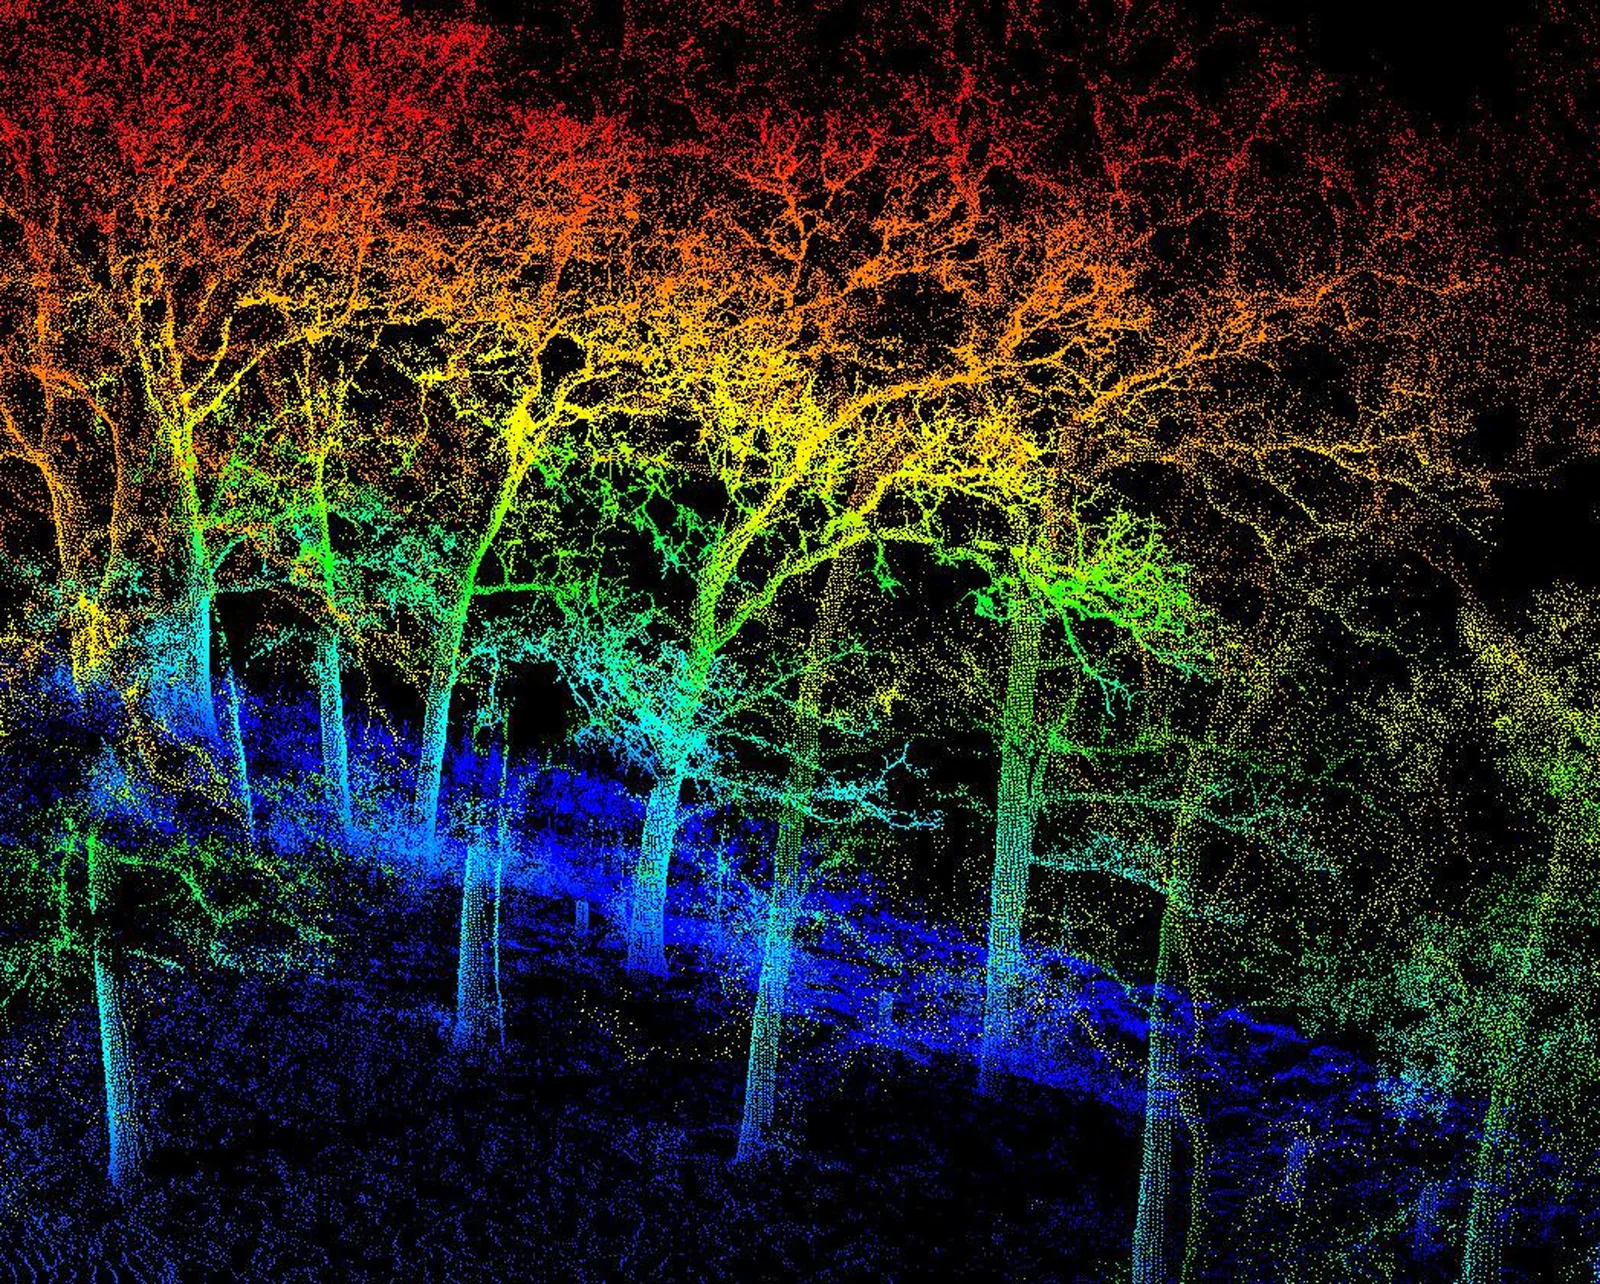
Tree-return profile13

Tree-return profile

Multiple LiDAR returns capture canopy, trunks and ground.
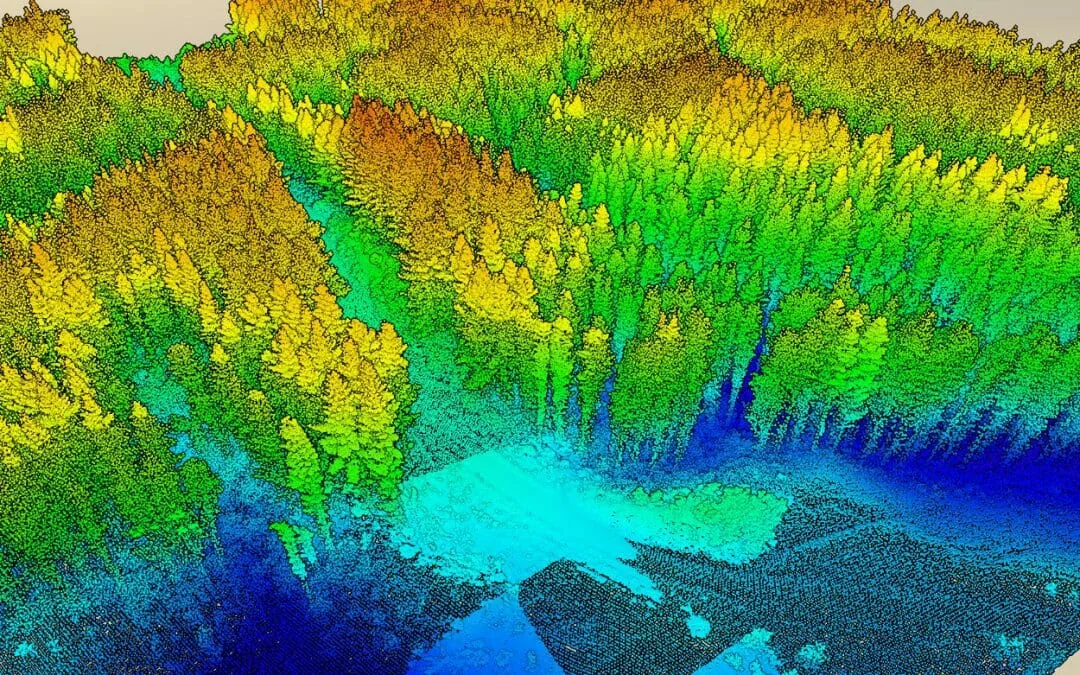
Forest point cloud14

Forest point cloud

A georeferenced coloured 3D representation of the forest.
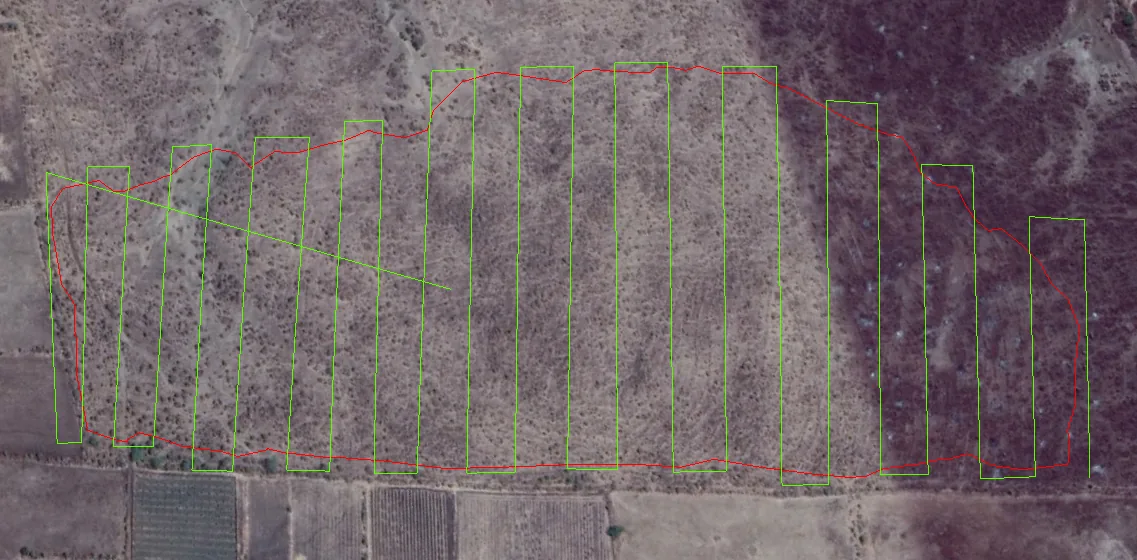
Mangrove flight plan15

Mangrove flight plan

Georeferenced survey segmentation for mangrove mapping.
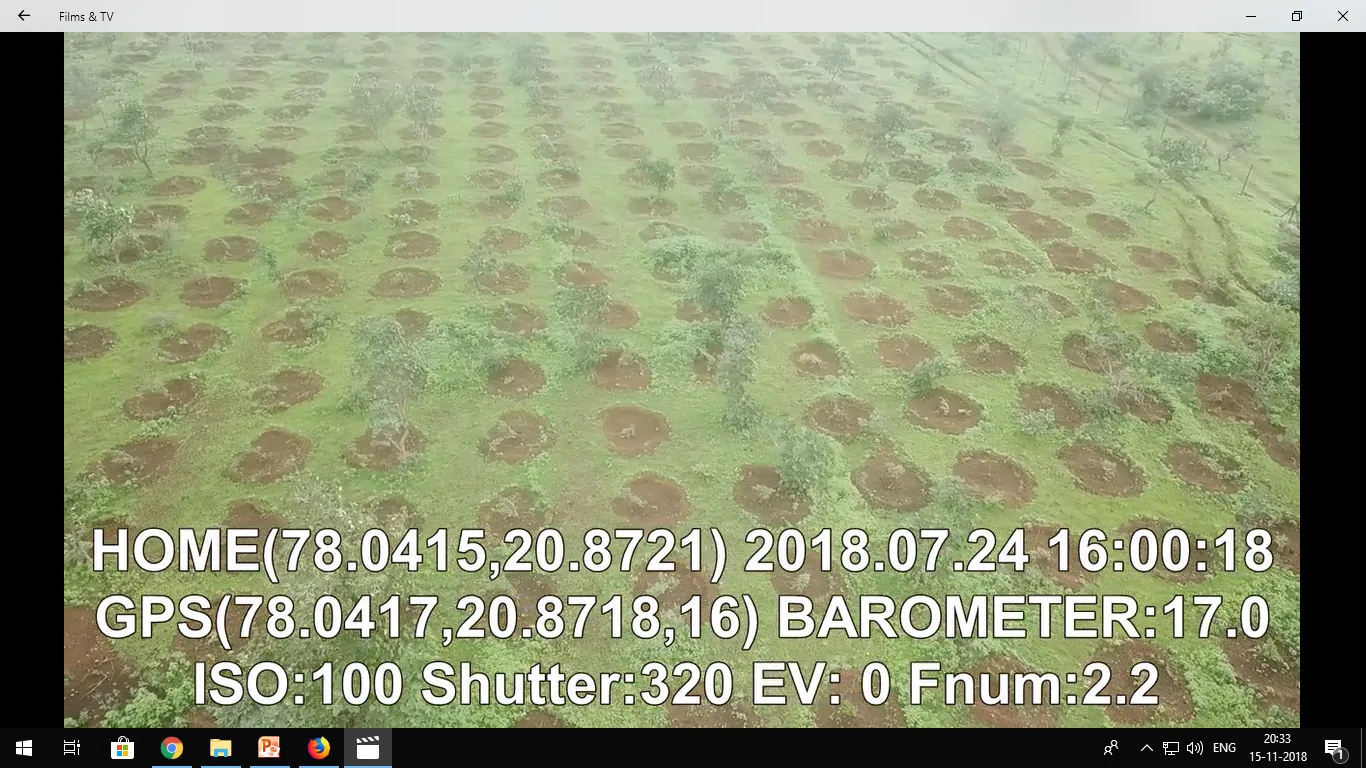
Georeferenced flight video16

Georeferenced flight video

Video evidence carrying path, coordinates, date and time.